Off to the Races
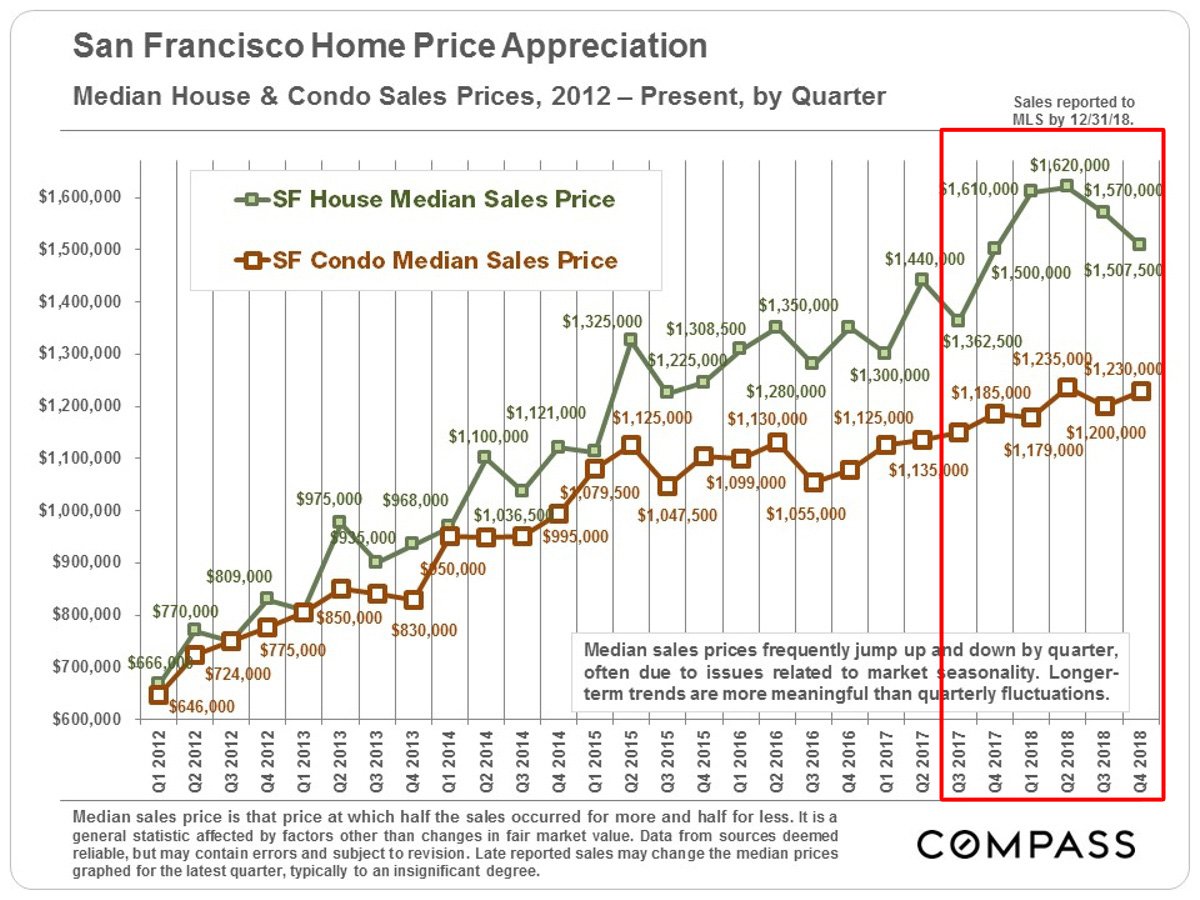
In 2018, San Francisco’s median house sales price was $1.6 million. That’s an increase of 13% over the previous year. Meanwhile, the median condominium sales price increased about 5% to $1,210,000.
If the chart above was the only one you consulted on SF real estate, you could be forgiven for thinking that since the 2012 recovery from the Great Financial Crisis, the city’s real estate prices have been rocketing inexorably upward.
Slow Finish
But you’d be wrong. As Mark Twain said, quoting Benjamin Disraeli: “There’s lies, damn lies, and statistics.” In 2018, the year had two very distinct halves. And if you don’t look at the statistics for those two halves, you’ll miss the real story here – which is that single family home prices fell precipitously over the last two quarters. The chart below shows price changes by quarter.
In a nutshell, the median price of a single family home in the last quarter of 2018 was essentially the same as it was a year earlier – $1.5 million. Homes lost $120,000 in 2 quarters. That’s a 7% drop in value. (Condos, meanwhile, remained basically flat.)
While our Chief Market Analyst, Patrick Carlisle, judiciously hedges his bets by pointing out that quarterly fluctuations are not unusual and also reflect seasonal variations, other data also supports the notion that we may – operative word, “may” – have reached some sort of inflection point.
Less Frenzied Over-Bidding
For example, “overbidding” – the difference between the list price and the ultimate sale price – dropped dramatically for single family homes in the last half of the year, even though it remains at high levels. Interestingly, the last time overbids declined significantly was from late 2015 through 2017; that may correlate with the massive drop in annual appreciation for 2016 and 2017 to single digits, whereas the previous three years’ returns were between 16 and 20% (see second chart below).
More Price Reductions
Another indicator: Price reductions in the fourth quarter hit their highest levels in over five years.
Still, Mixed Signals
Not all the statistics point clearly to a softening market. For starters, supply remains constrained and at historically low levels. I’ve described this elsewhere as a secular shift, reflecting, perhaps, an aging population that chooses to age in place rather than to move.
In addition, Average Days on Market (DOM) remains very low for most single family homes as the following charts shows. While DOM for the most expensive homes rose significantly in the last two quarters, there are so few sales in this segment that statistics tend to be volatile anyway.
If we see any current weakness in the market, however, it’s in high-end condos ($3+ million) where new construction in recent years has created oversupply. The next chart shows that DOM for this segment has been between 40 and 60 days for two years. Most other markets would love to have a DOM statistic of 60 days. In San Francisco, that’s considered l-o-n-g.
Bay Area Perspective
For a broader perspective we can look at the Case Shiller Index for the SF Metro Area. It aggregates data for five Bay Area counties: San Francisco, San Mateo, Alameda, Contra Costa and Marin. San Francisco represents a tiny part of that index – only 7% of all sales. And virtually all of those sales would fall within the “high price tier” of the Index. Still, if there’s one thing we should have learned by now it’s that SF is not immune from broader market trends.
The first chart below confirms how, Bay Area wide, there was price slippage in all price tiers starting in the summer months of 2018. The second chart, with a longer perspective, shows how lower and mid-priced homes generally appreciate faster during run-ups and then drop faster and further during slowdowns. The same phenomenon applies to SF itself. As people get outbid on homes in their “A” list neighborhoods, they bid up prices in neighborhoods deemed less desirable. When the market drops, buyers focus again on the “A” list neighborhoods and avoid the B-List , thus exacerbating the decline in the latter.
Caveats, IPO’s, and Wild Cards
It’s worth remembering that the end of 2018 saw one of the most volatile stock market rides in recent history. That, in itself, could have contributed significantly to the weakness we saw in the real estate market in the second half of the year. If the stock market stabilizes and returns to its bullish ways, maybe that end-of-year weakness will be just a blip.
With a handful of high-profile Bay Area unicorns going public (including Lyft, AirBnB, and Uber), there’s speculation that the resulting crop of newly minted millionaires will bid up the market as they look for homes. As I’ve written previously, in a market as small as San Francisco, that’s a plausible theory. However, three studies report in a recent article in the SF Chronicle suggests that if there’s an effect at all, it’s limited.
Then there’s Brexit, Venezuela, North Korea, a trade war with China, and the possibility of another government shut-down, not to mention Robert Mueller and a certain volatile public figure who is the subject of his inquiry.
As the Chinese proverb says: “May you live in interesting times.” Happy New Year!
As always, your comments, questions and referrals are greatly appreciated!
Misha


