
I’m barely into the New Year, and The New York Times headline shrieks “They Can’t Leave the Bay Area Fast Enough !!!” [OK, the exclamation points are mine.] Not only that, but “a tech era,” no less, is drawing to an end. Can the extinction of the dinosaurs, not to mention the collapse of San Francisco real estate values, be far behind?
It’s true that San Francisco residential rents have fallen by 27%. It’s true that many techies and non-techies have found the lure of a suburban back yard in the time of Covid isolation a compelling reason to move away from the City, especially when all the restaurants, bars, gyms, and other urban entertainment options are closed. Indeed, according to the annual United Van Lines survey, more people moved out of California in 2020 than into it, and that goes for the Bay Area as well.
But, my goodness, if there was ever a time for a collapse in real estate values, surely you’d think it would have been in 2020 – with a global pandemic raging the likes of which we hadn’t seen since 1918; office buildings, businesses, restaurants, shuttered; runs (if you’ll pardon the expression) on toilet paper; and the most rancorous, fractious general election in perhaps a century raging in the background.
It didn’t happen. While our oft-quoted Patrick Carlisle put together his usual stellar summary of the year in real estate, available here if you scroll down to the January newsletter, I wanted to see what some key metrics for 2020 looked like when compared directly to 2019. So I crunched the numbers myself. Take a look. (All charts based on data from SF Association of Realtors and other sources deemed reliable, blah blah blah.)
Sales Volume
The first two charts show the precipitous decline in the number of house and condo sales as a result of the Shelter-in-Place Order (SIP Order) that went into effect in mid-March, and whose effects were seen in the drop in reported sales about 30 days later in April.
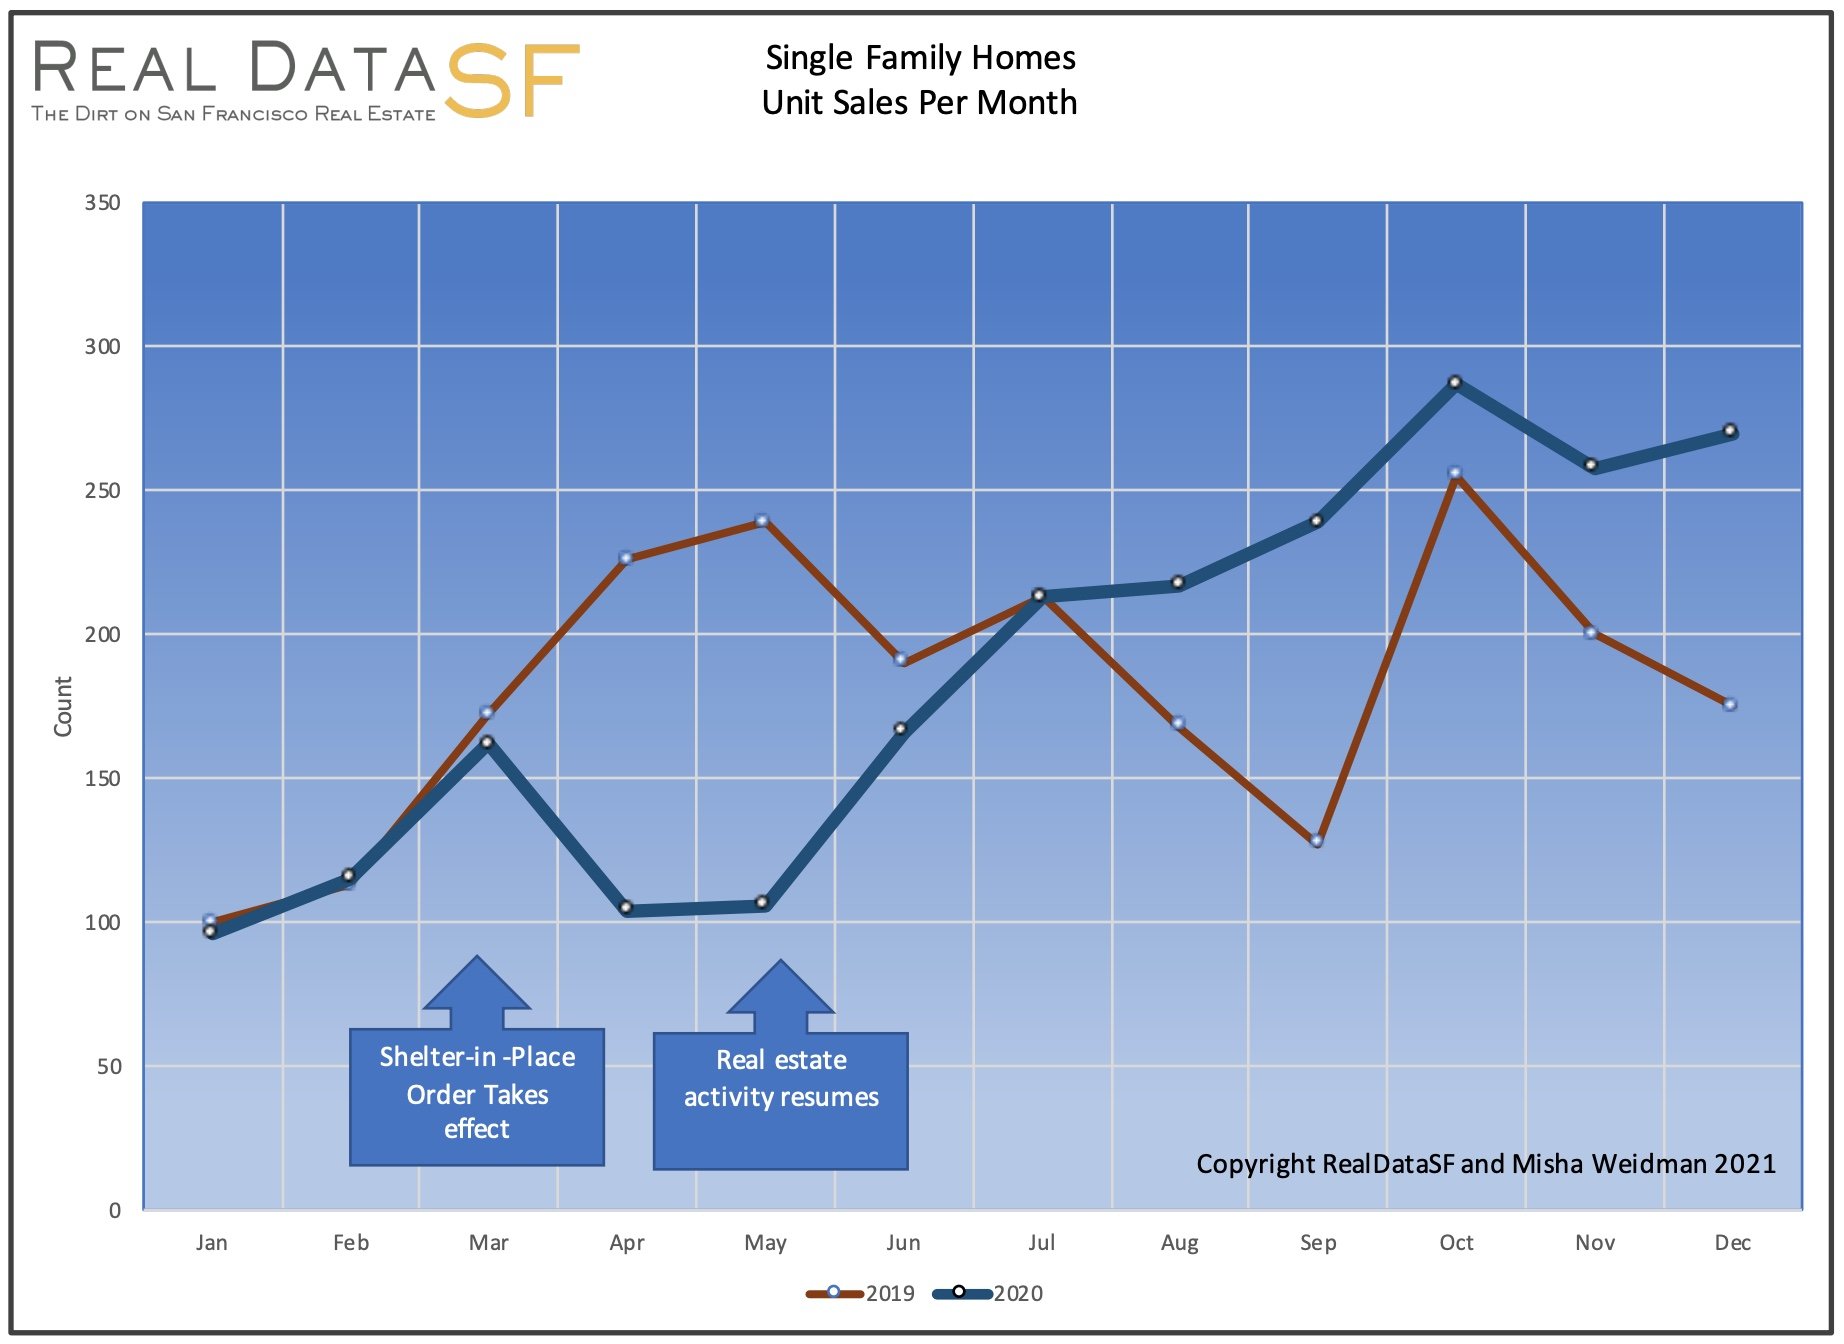
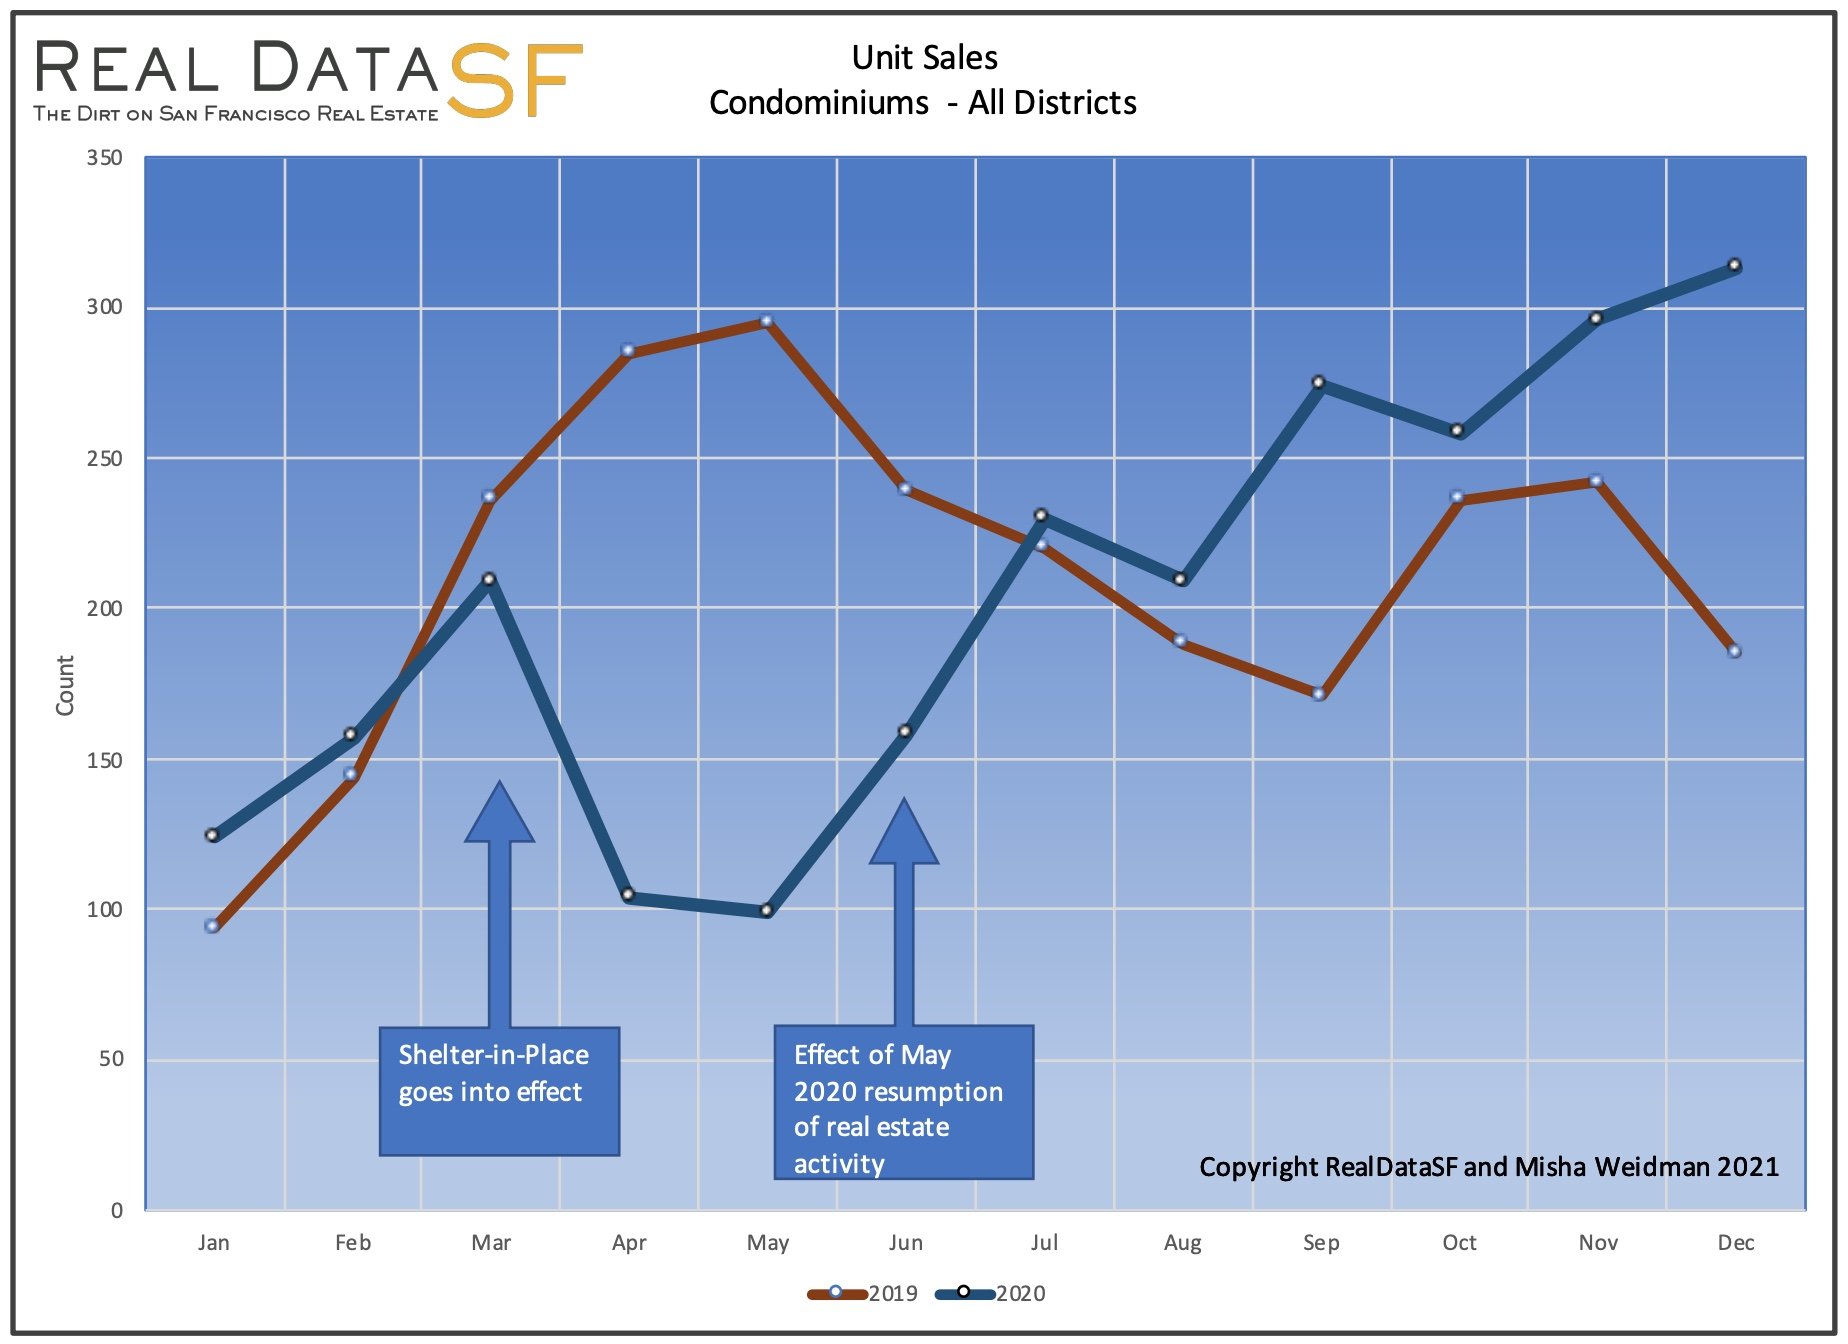
In both cases, the number of sales bounced right back as soon as residential real estate activity was allowed to restart in early May, with the effects again being seen in the data about a month later in June. And whereas sales typically slow during the summer as people leave for vacation, in 2020 they did not. Rather, they continued to climb. Why? Pent up demand from the spring and the fact that Covid-19 canceled the 2020 summer vacation season.
Comparing 12 months through January 2021 to the previous year, sales volume was down less than 3% overall, with single family home sale up about 1.5% and condo sales – which now account for over half of all sales — down about 6%. Not a bad performance for a tumultuous year.
High Rise Condos – a Different Case
With increased demand for outdoor space – see the “flight” to the suburbs – it’s no surprise that condominiums faired more poorly than single family homes. And nowhere did condominiums fare worse than in SF’s high-rise neighborhoods like SOMA, South Beach and Mission Bay. These areas are broadly covered within “MLS District 9.” The chart below shows that although sales bounced back after the SIP Order eased, they did not continue to rise through the summer months like single-family homes and condos as whole. Rather, they kind of bounced along at 2019 seasonal levels, thus never regaining the ground they’d lost during the shutdown.
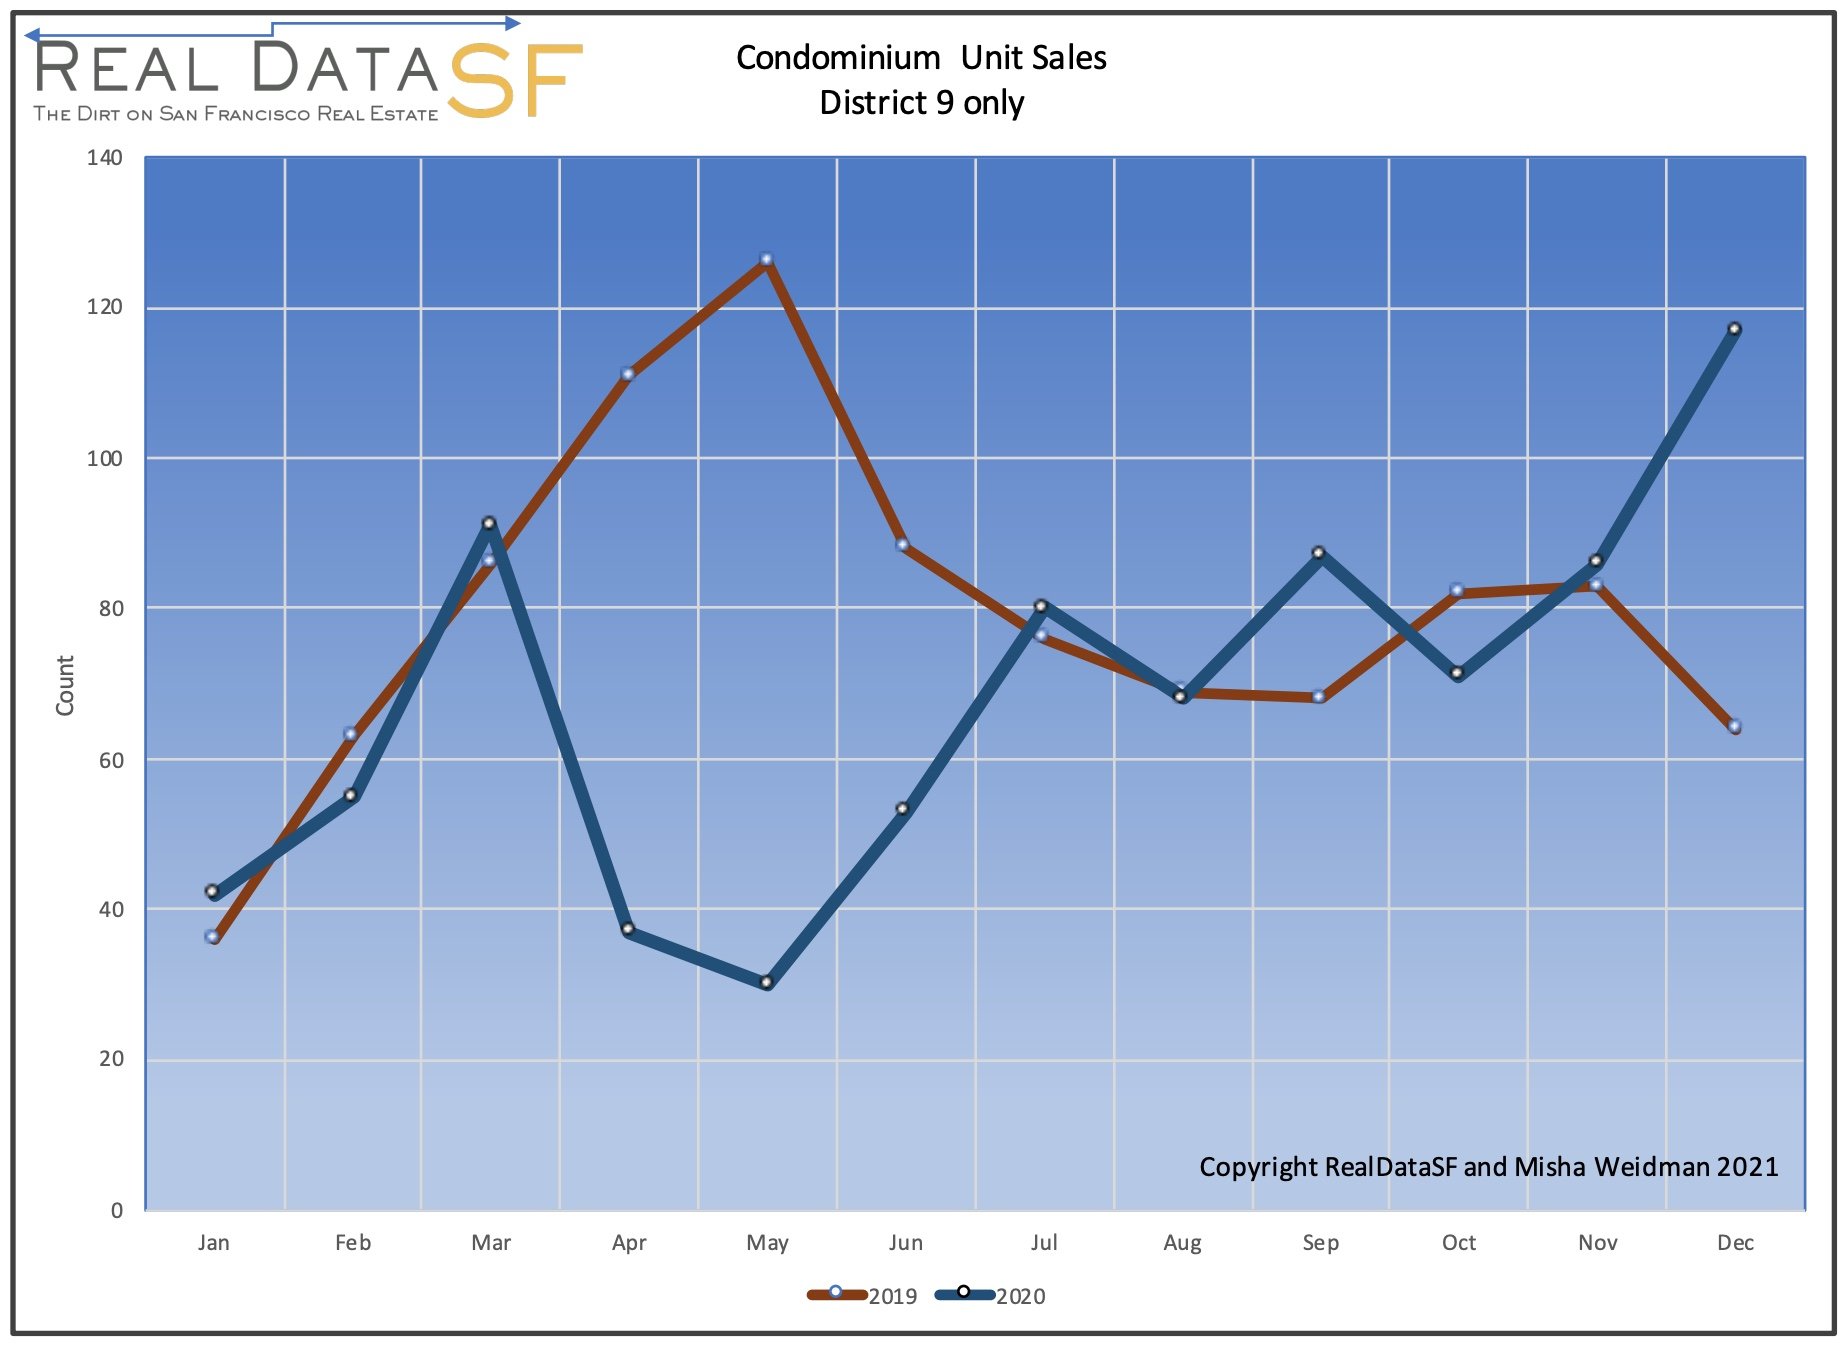
Interestingly, District 9 does seem to have recovered strongly at the end of the year. It’s a bit soon to say, but I’m wondering whether this represents newfound optimism around vaccination efforts and the possibility that all the attractions of urban life may soon return.
Prices
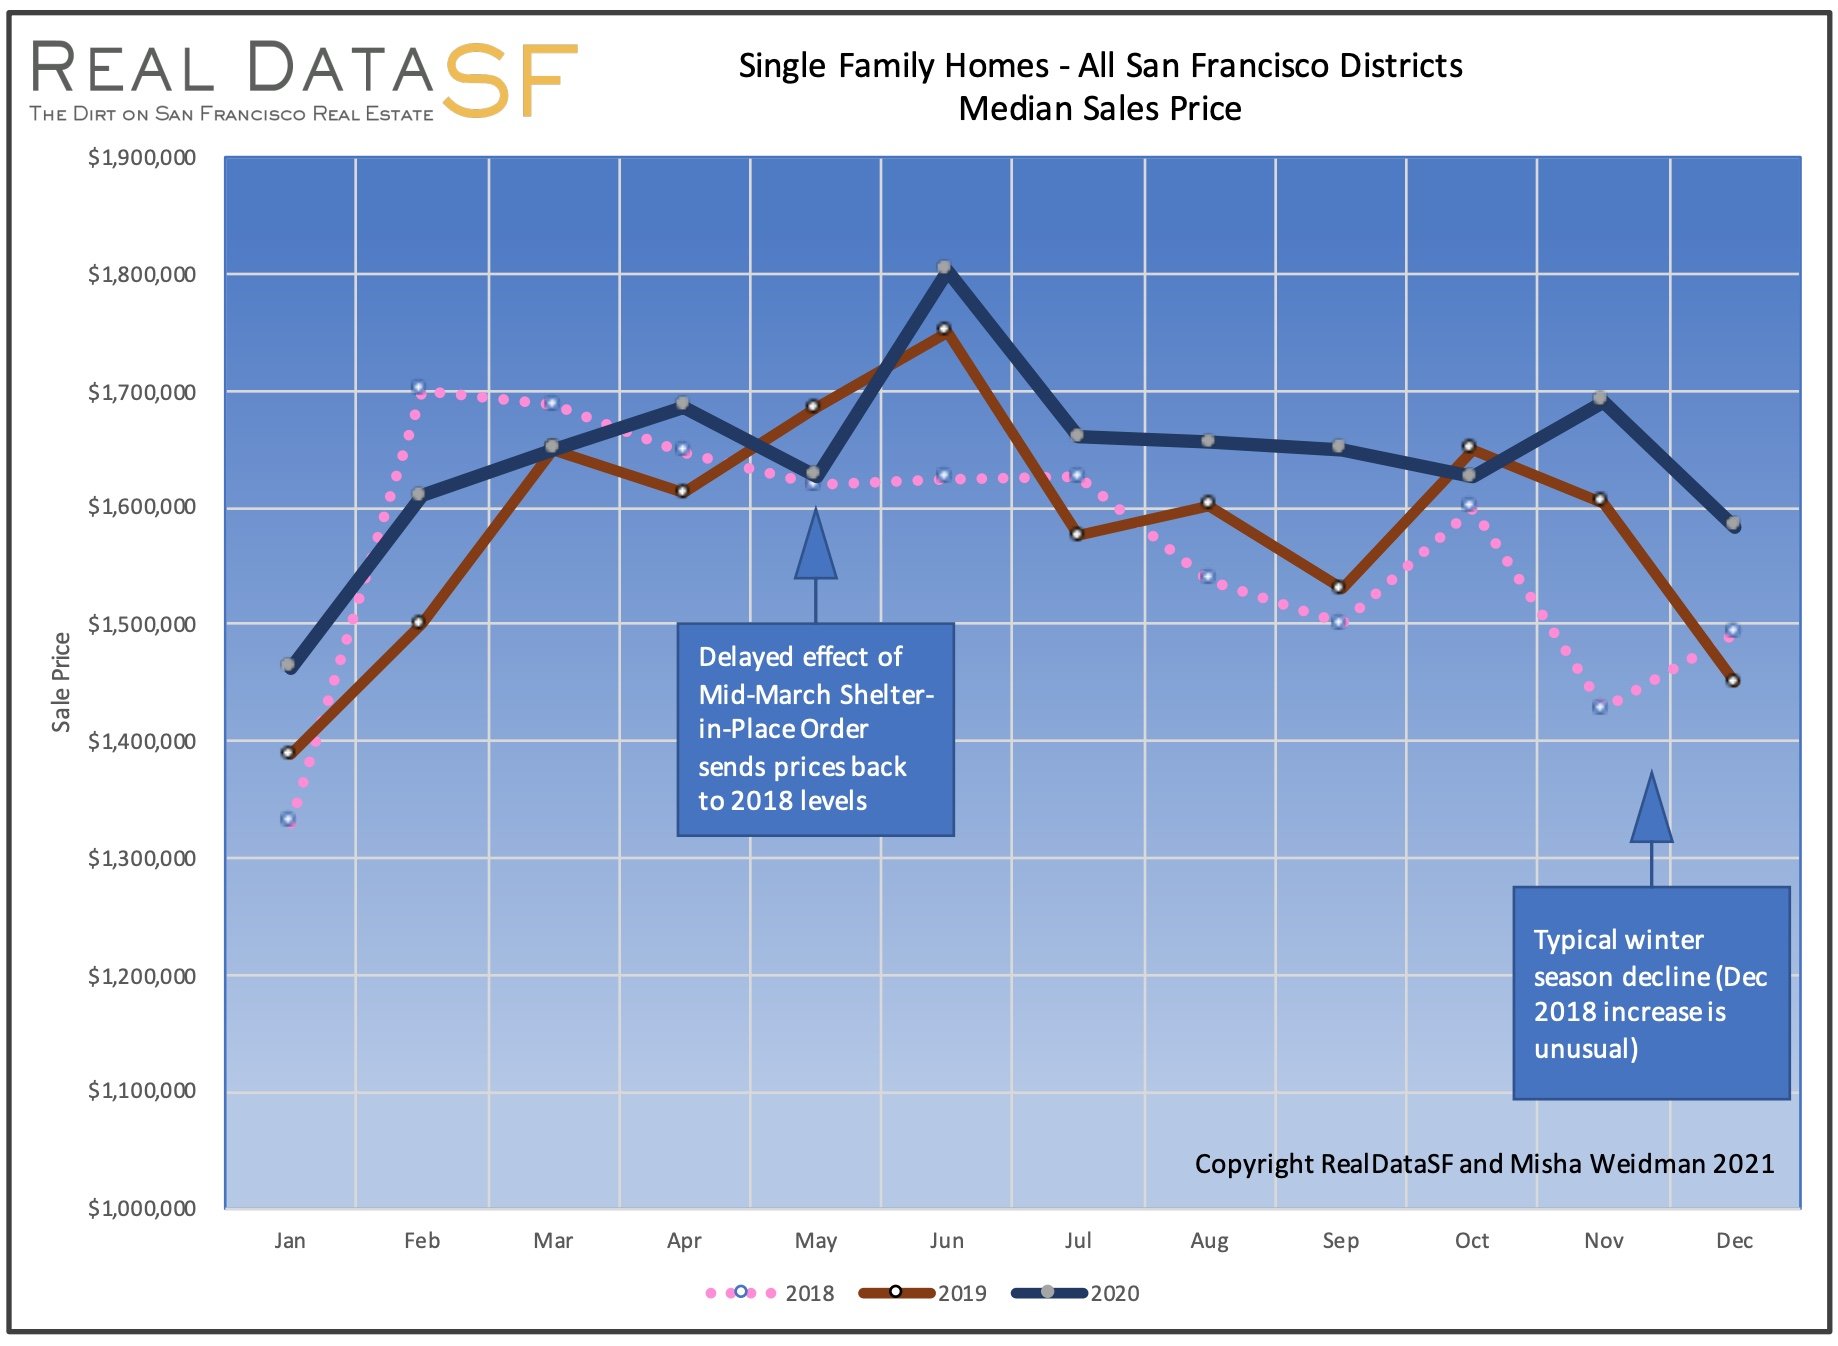
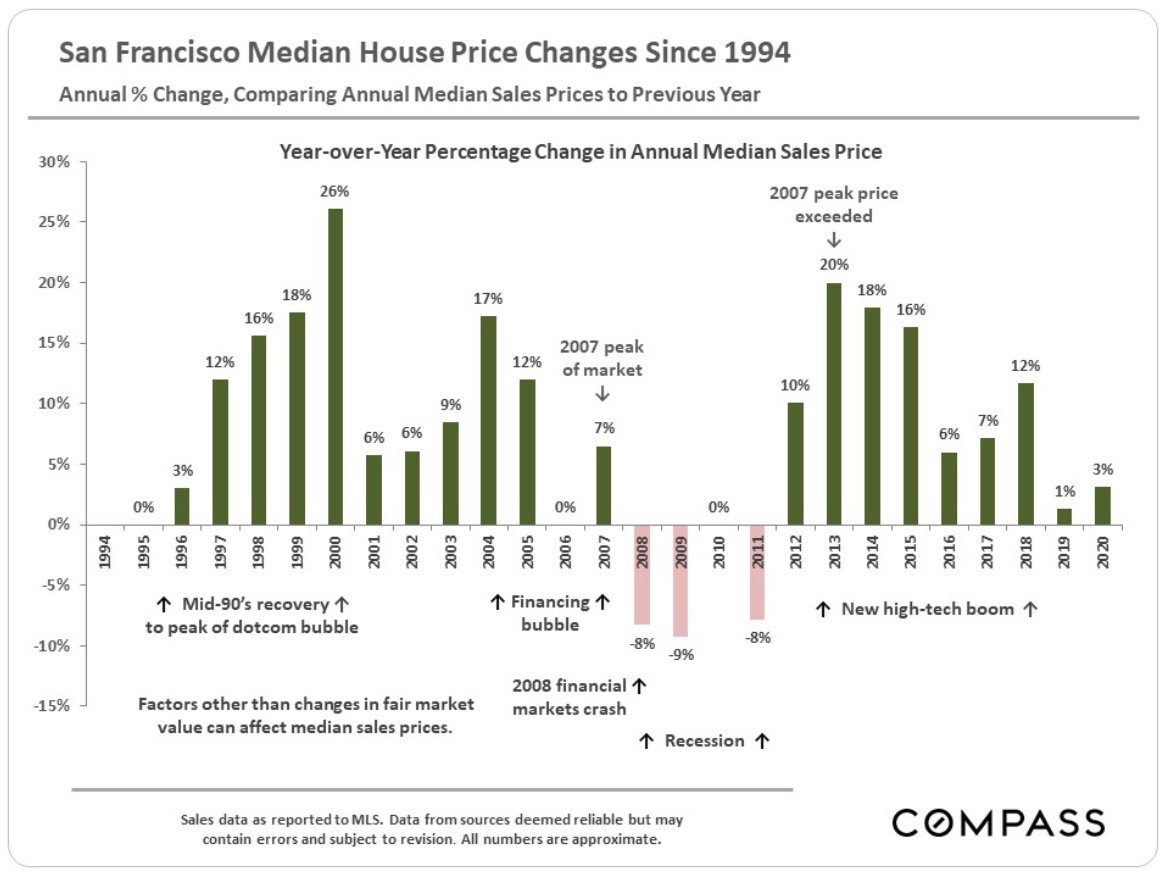
But what about prices? Single-family home prices slumped during the SIP Order, recovered smartly after it was relaxed, and then generally stayed above 2019 values while following the usual autumn and winter seasonal pattern (first chart below). The annual median price ended up 3% over 2019 (second chart below).
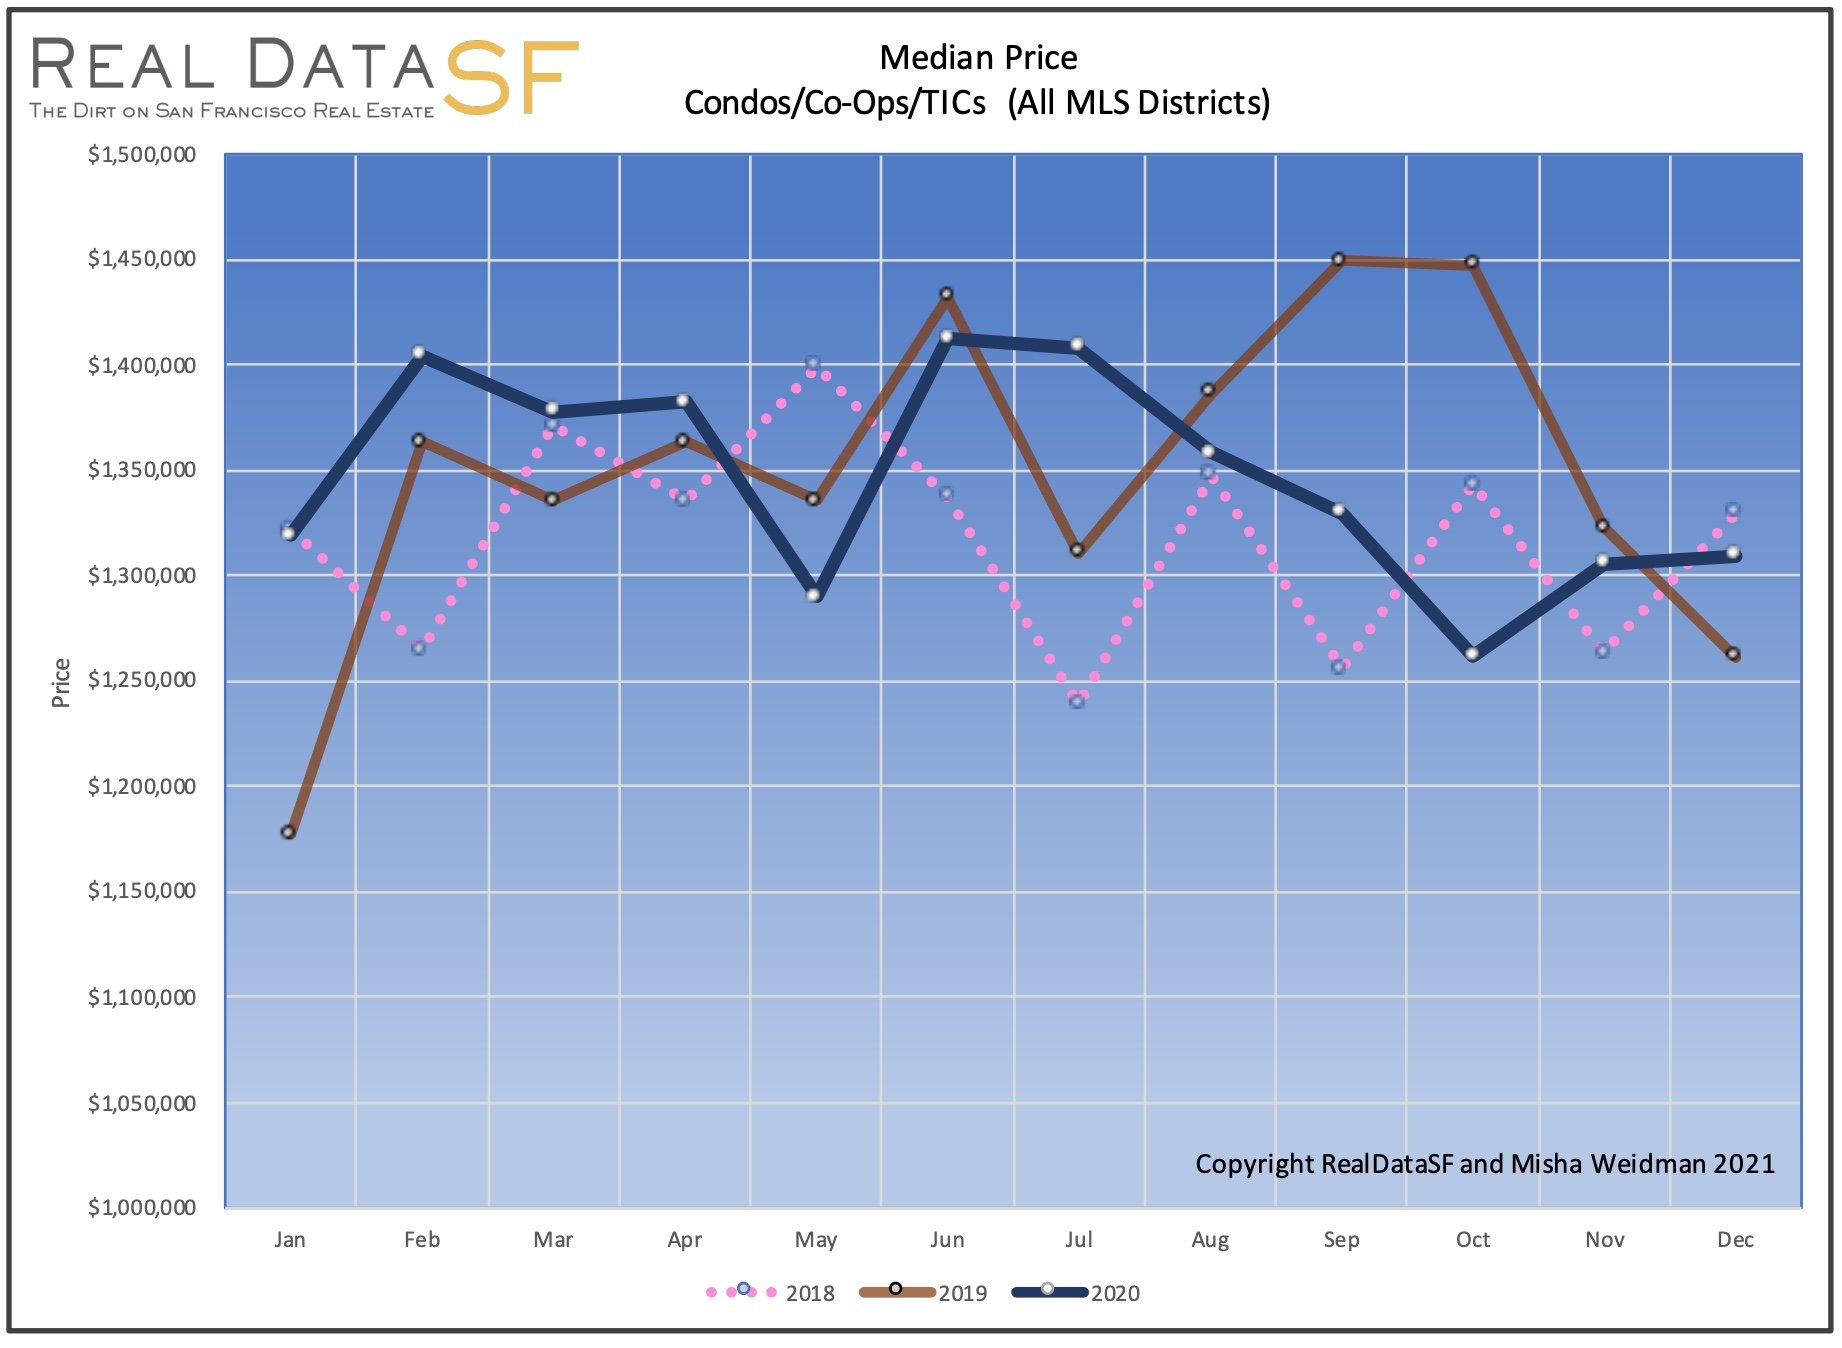
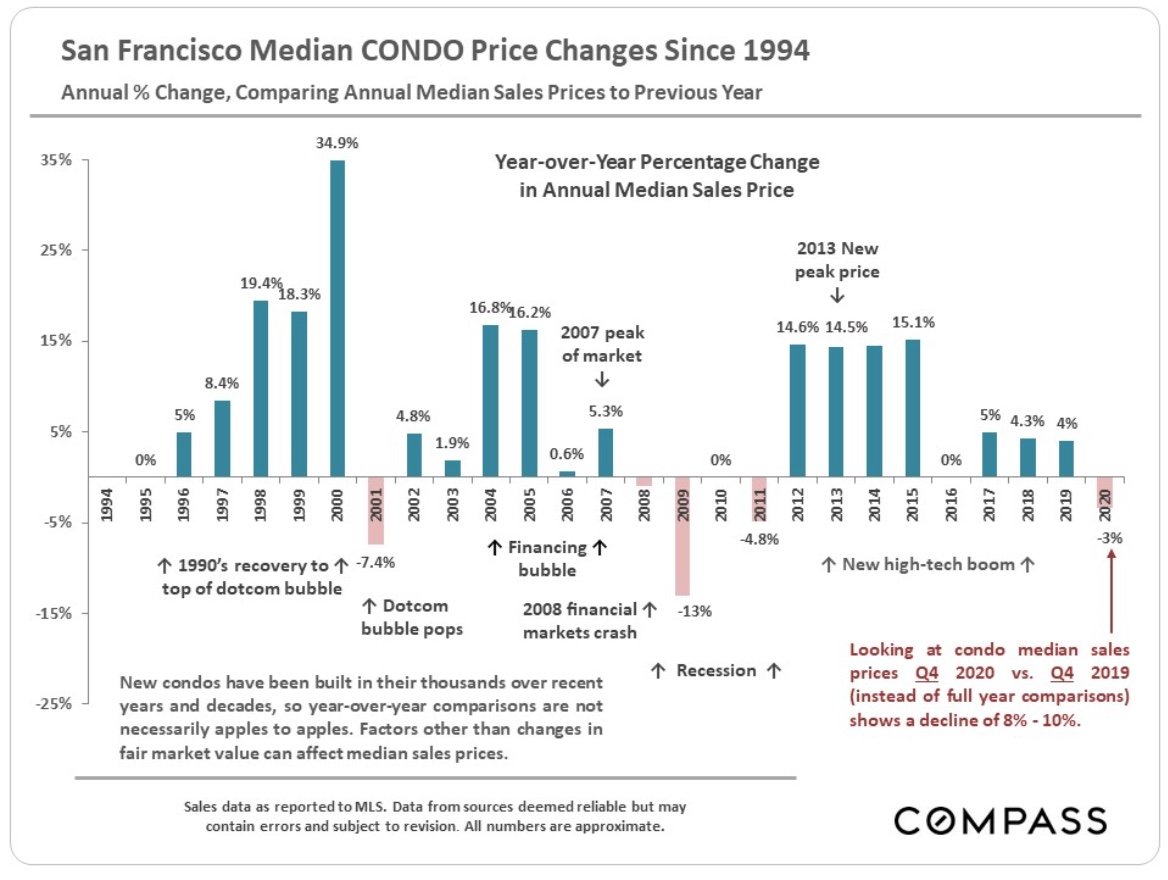
For condominiums, the story was less positive. Though prices initially recovered along with volume after the SIP Order was relaxed in May, they trended downwards for most of the remainder of the year – well below 2019 levels and dipping below 2018 levels in October. We may have seen the beginning of a recovery in December, but it’s too soon to tell. The annual median price ended down 3% compared to 2019 – much more if comparing Q4 2020 to Q4 2019 (second chart below).
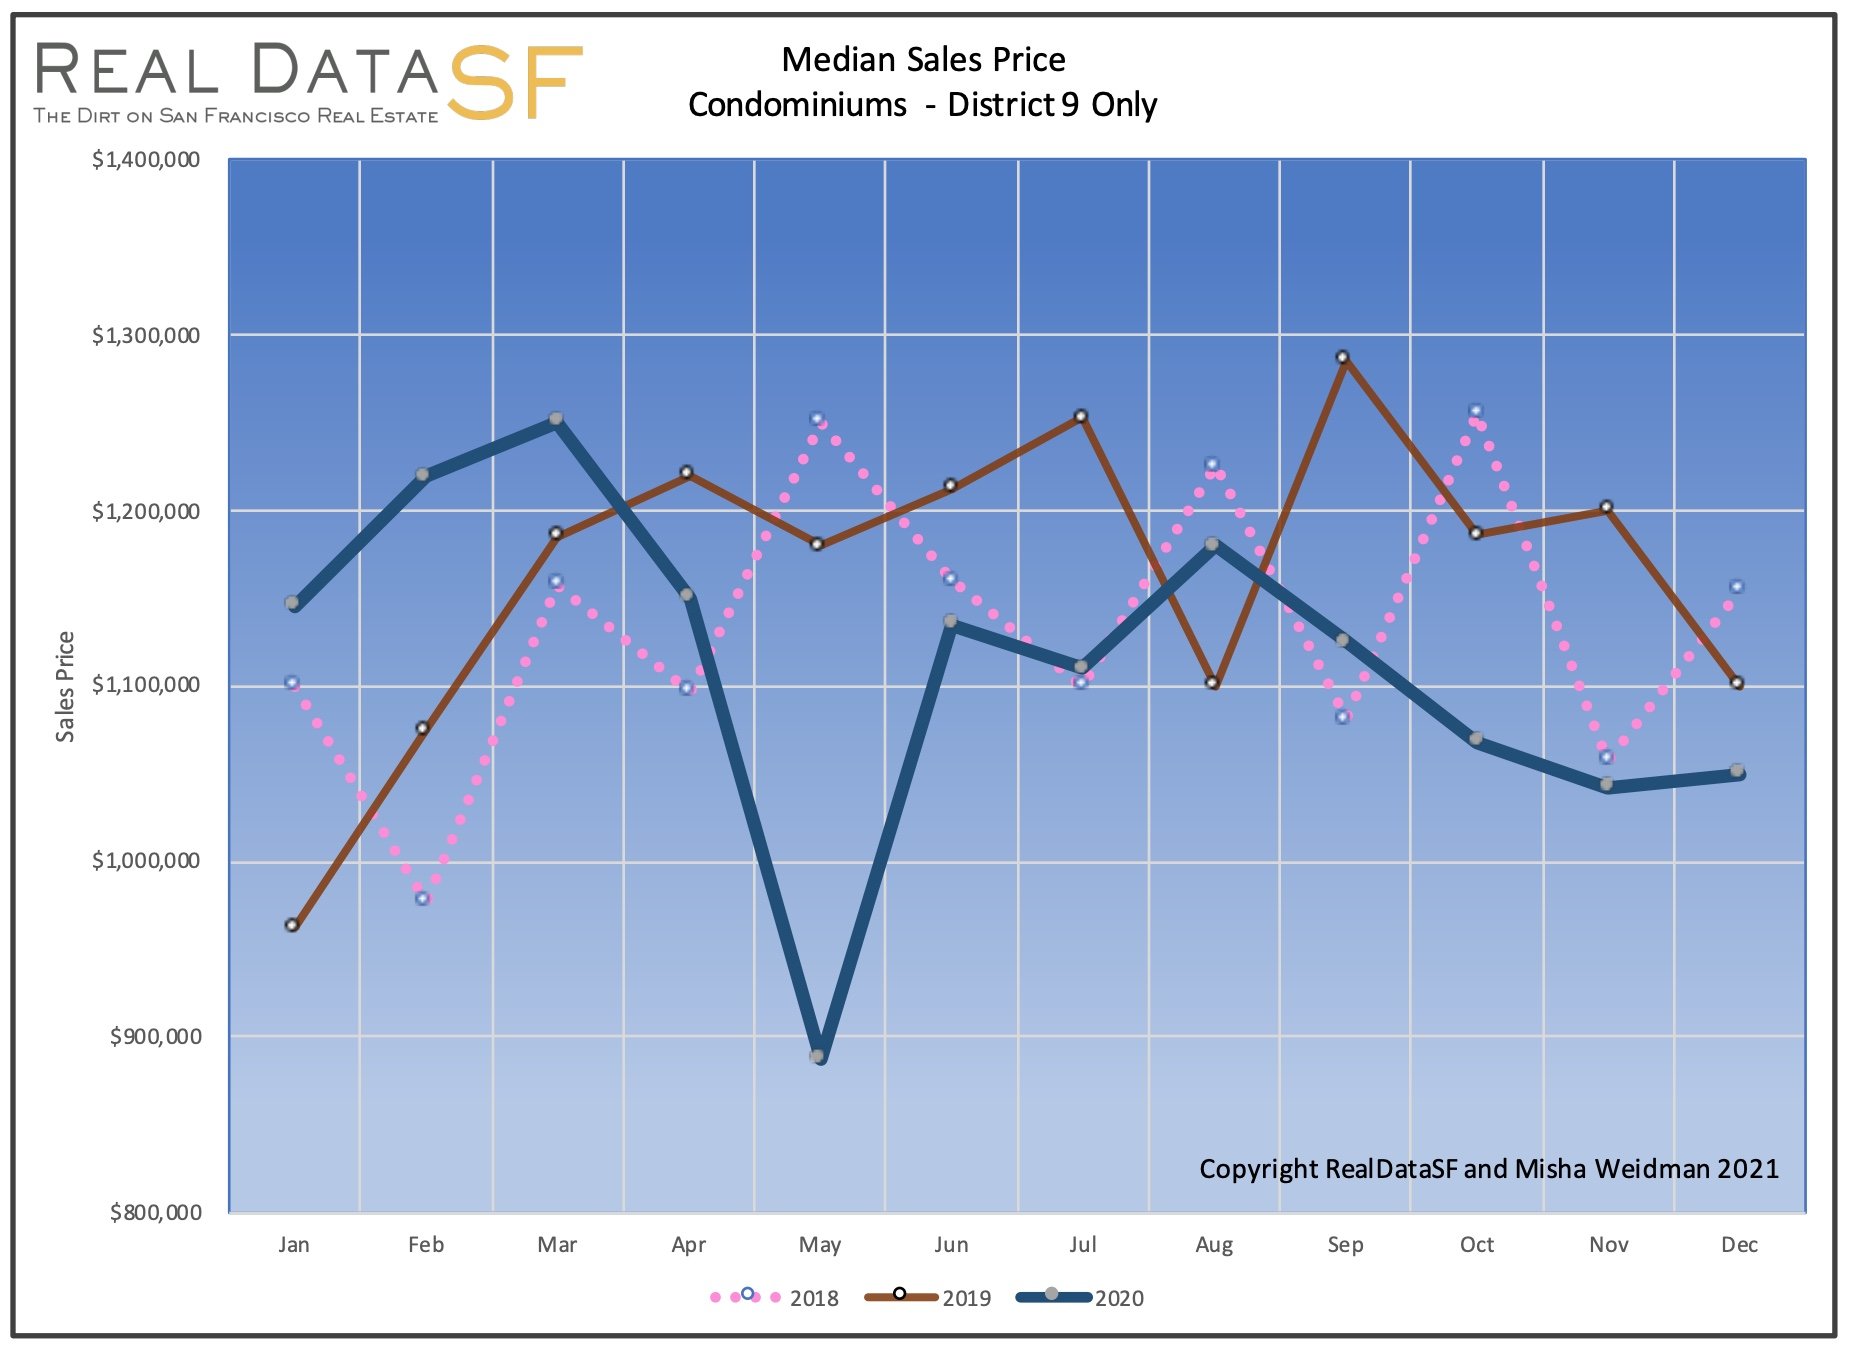
District 9 condos fared worse. While prices recovered with the lifting of the SIP Order, they trended below both 2019 and 2018 levels for the remainder of the year (chart below). Perhaps the year-end spike in volume discussed earlier will portend a recovery in prices for this hard-hit area.
The Demise of San Francisco and the Bay Area?
Frequent readers of my newsletter know that I am not one to view the SF real estate market as always rosy. On the contrary, I predicted back in April 2020 that the longer the pandemic went on, the worse the market would get. (I also admitted that I was wrong in October.) But anyone who bets against the long-term strength of the San Francisco real estate market does so at his or her peril, in my opinion. It’s been a long and terrible 9 months, for all sorts of reasons. And yet, the San Francisco market has, overall, held up well. While commercial office space may not recover for a long time, and while we may be moving to a new model of mixed remote and onsite workplaces, I deeply believe that our need for “society,” for social gathering, will always animate San Francisco and cities like it.
Moving forward, myself and my colleagues are seeing huge buyer demand, especially for this early in the year. Offer deadlines, multiple bids, and bids well over asking are once again the norm for many properties – especially single-family homes. Barring a major shock to the economy or the stock market, or – heaven forfend – the resurgence of the virus, I foresee a very strong 2021 for San Francisco real estate. Stay tuned, and Happy New Year everyone!
As always, your questions, comments, and referrals are much appreciated!
Misha