
I was wrong – kind of. In my April newsletter I opined: “The longer the crisis continues, the more likely it is that it will do long-lasting damage to the economy and the real estate market itself.” But, looking at the numbers in the chart below, you’d never know that we are now eight months into a global pandemic.
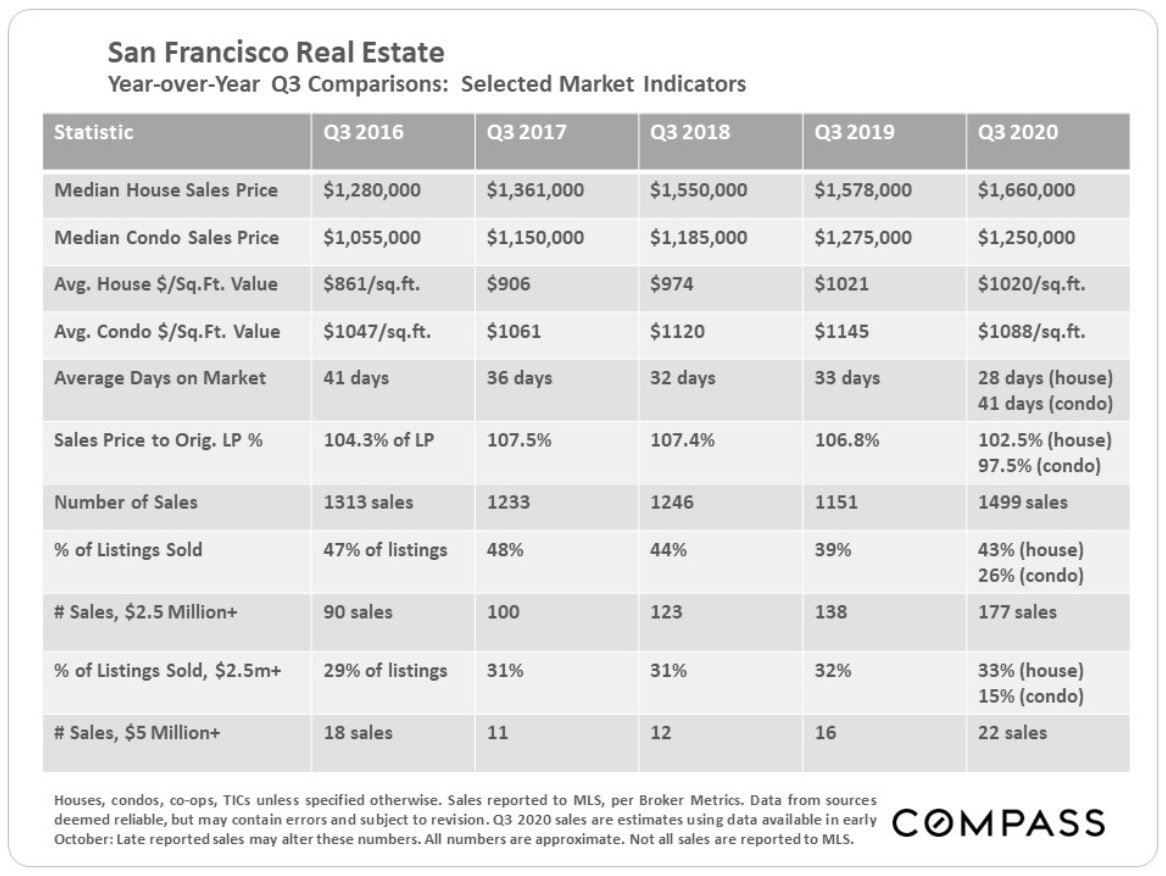
Median house sales prices are well over where they were a year ago. Condo prices are not down by much. Days on market (DOM) for single family homes is a brisk 28 and they are still selling at a slight premium to asking price (102.5%). The number of combined luxury houses and condos selling above $2.5 million is up substantially (177), as is the number of super luxury houses and condos (22).
Indeed, it’s not just San Francisco that is experiencing a buoyant housing market. A recent article in The Economist suggests that many “rich” countries are seeing house prices surge even as a second wave of covid-19 infections hit. Between historically low interest rates, loose governmental monetary policies, and a trend towards roomier homes, “higher house prices could turn out to be an enduring legacy of covid-19.”
Apples and Oranges
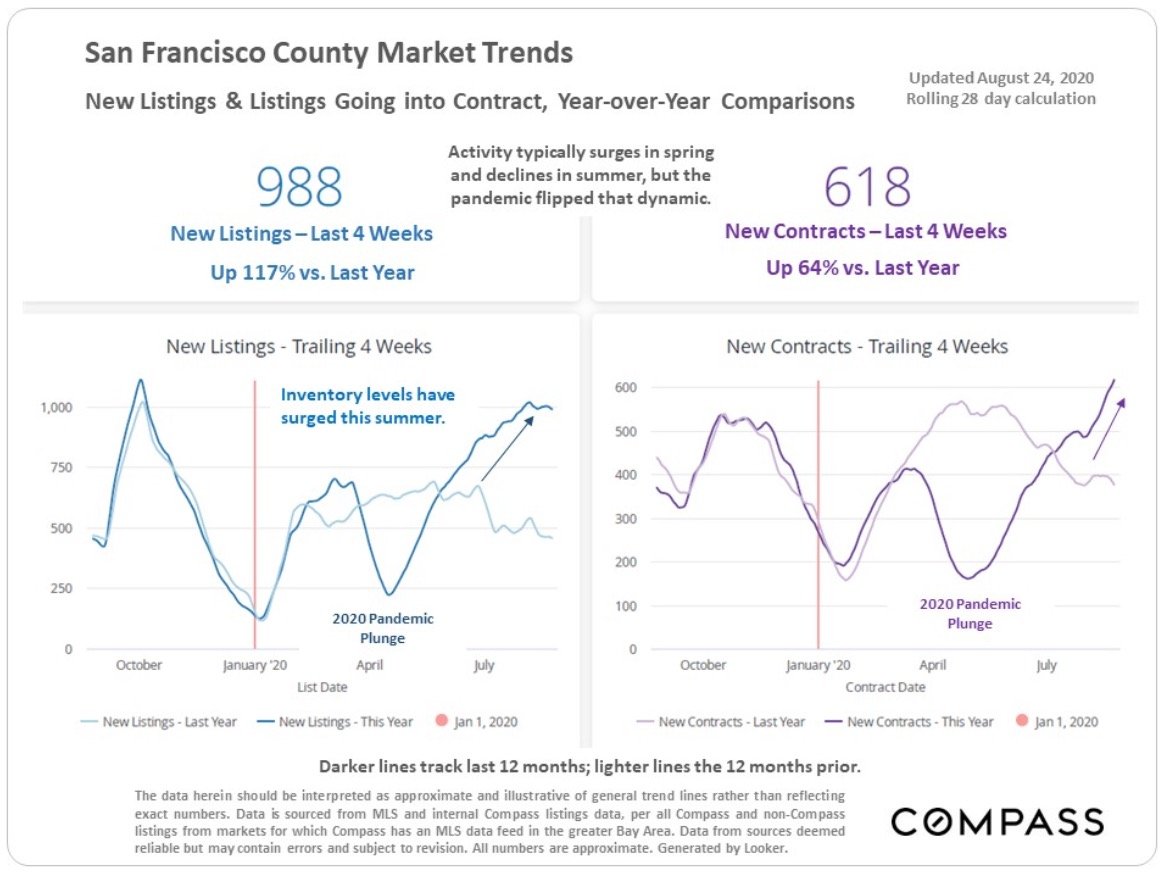
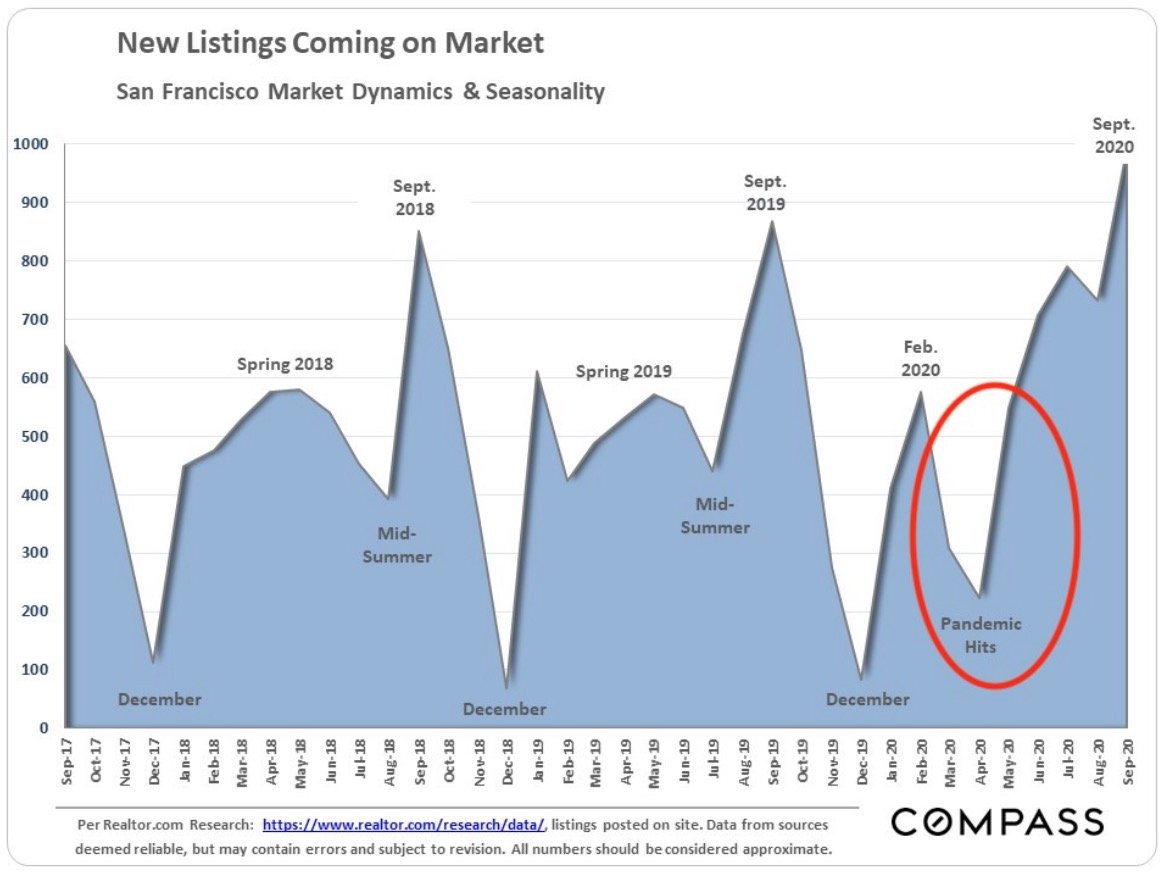
Look at the SF data more carefully, however, and a more complicated picture emerges. Firstly, the year over year quarterly comparison may be misleading. There’s a strong seasonal component to the housing market, with the strongest sales typically occurring in Spring and Autumn. This year the Spring season got halted in its tracks by shelter-in-place. Instead, it shifted into the summer months, which are typically slower until Labor Day. Thus, the apparent strength of third quarter results may be in part because we’re actually comparing a delayed Spring quarter (think pent-up demand and a flood of new inventory) to a more normal slower Summer quarter. The next two chart show dramatically how the pandemic completely disrupted the usual Spring and Summer cycles.
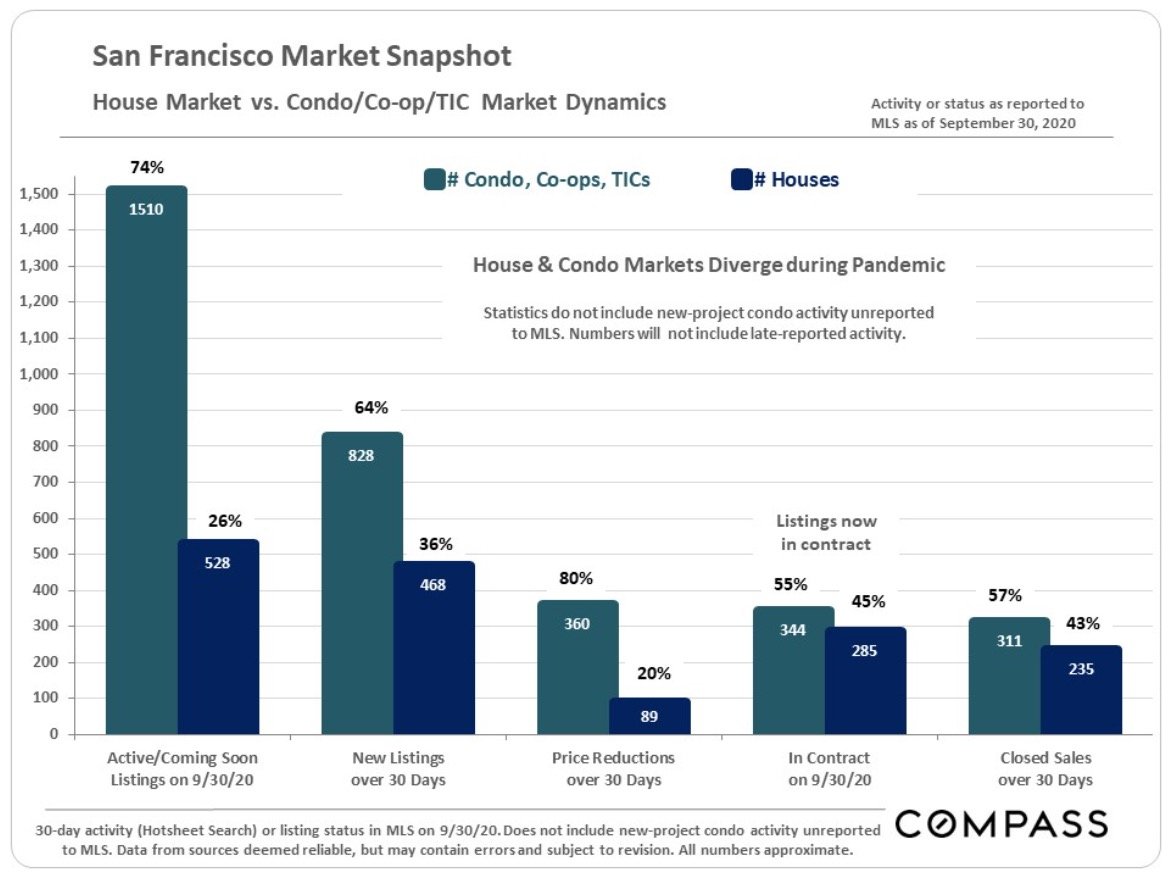
Secondly, there’s increasing evidence of a divergence between the market for single family homes and that for condominiums. (There’s also evidence of divergences occurring between sub-segments of the condo segment itself – for example between condos in high-rise buildings and those in smaller 2-4 unit buildings. I provided some details on this in my previous newsletter.) It’s for this reason that we broke out some of the stats for single family homes and condos separately in the first table, above. For example, while 43% of house listings sold in Q3, only 26% of condo listings sold in the same period. Bear in mind that condos now represent over 50% of the sales market.
Nowhere is the divergence of the condo and single family home market clearer than in the following chart, which tracks “Months Supply of Inventory” (MSI), a basic measure that matches demand to supply.
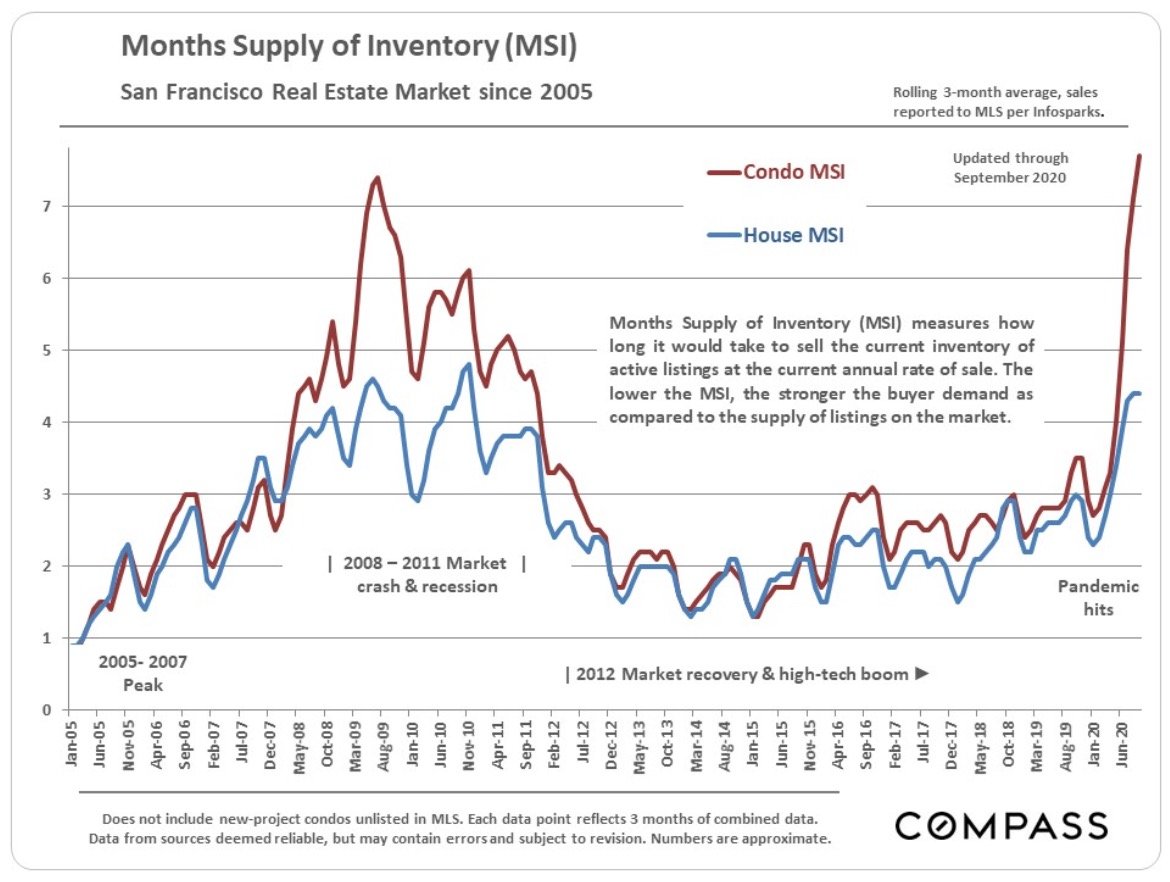
While both houses and condos have seen significant increases in MSI, condo MSI has gone through the roof. Since MSI can increase due to fewer properties going into contract (demand), more properties available on the market (supply), or a combination of both, let’s take a closer look at what’s driving the increase in MSI.
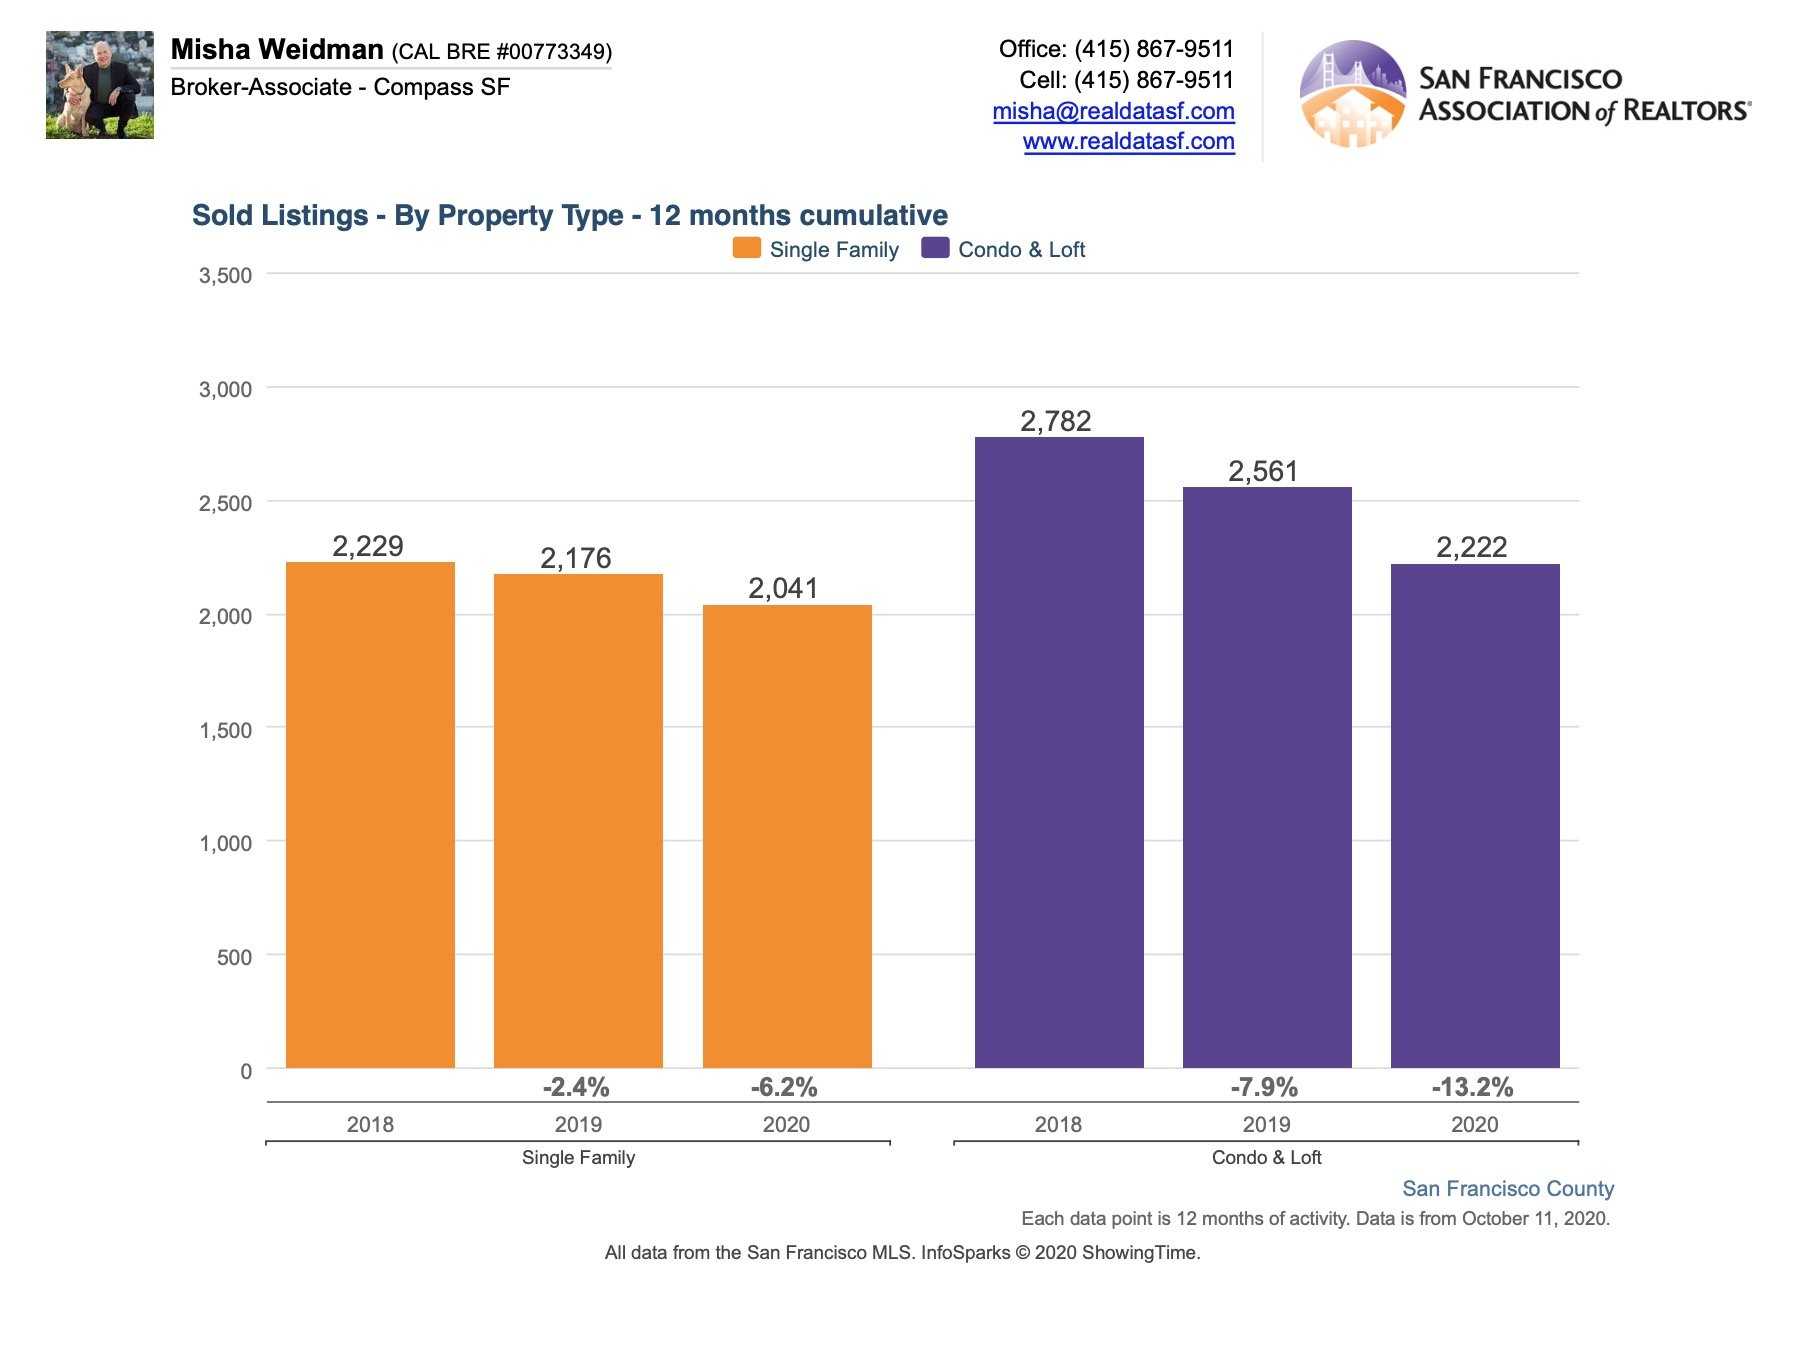
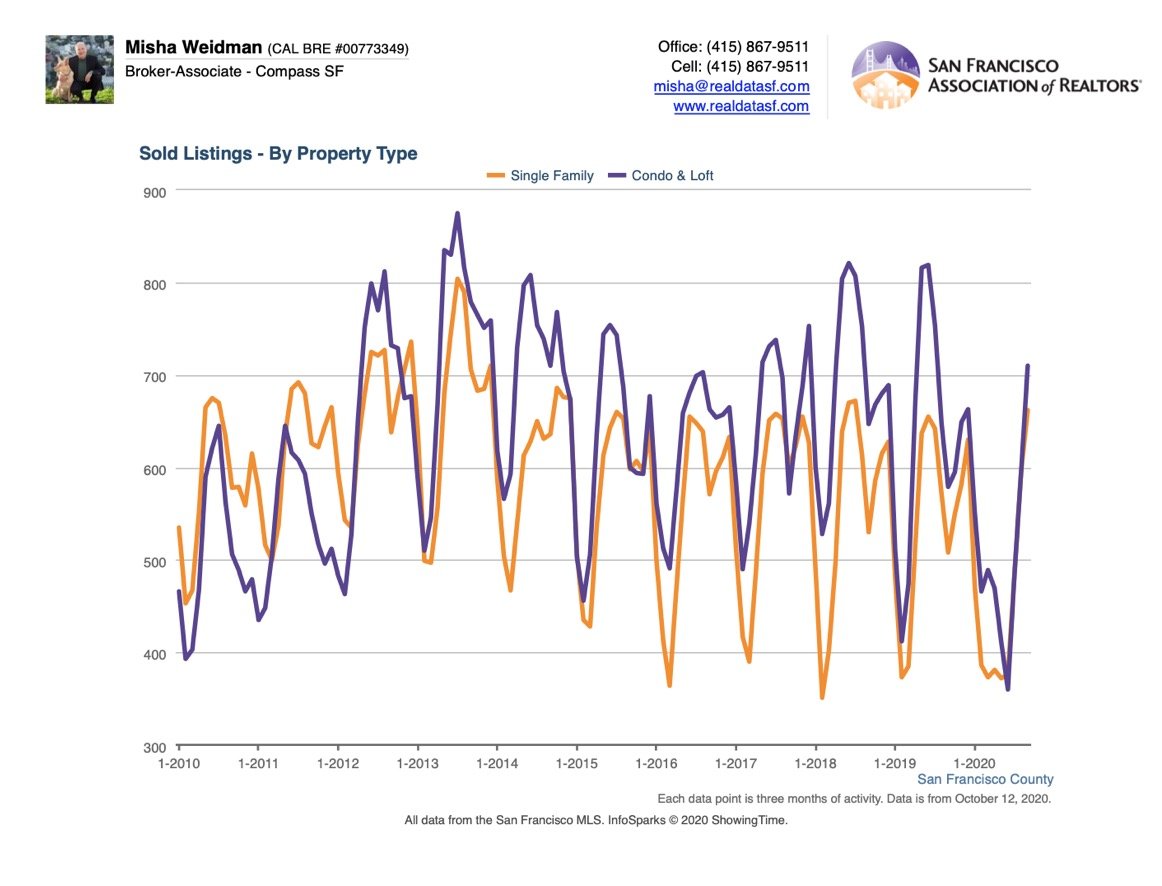
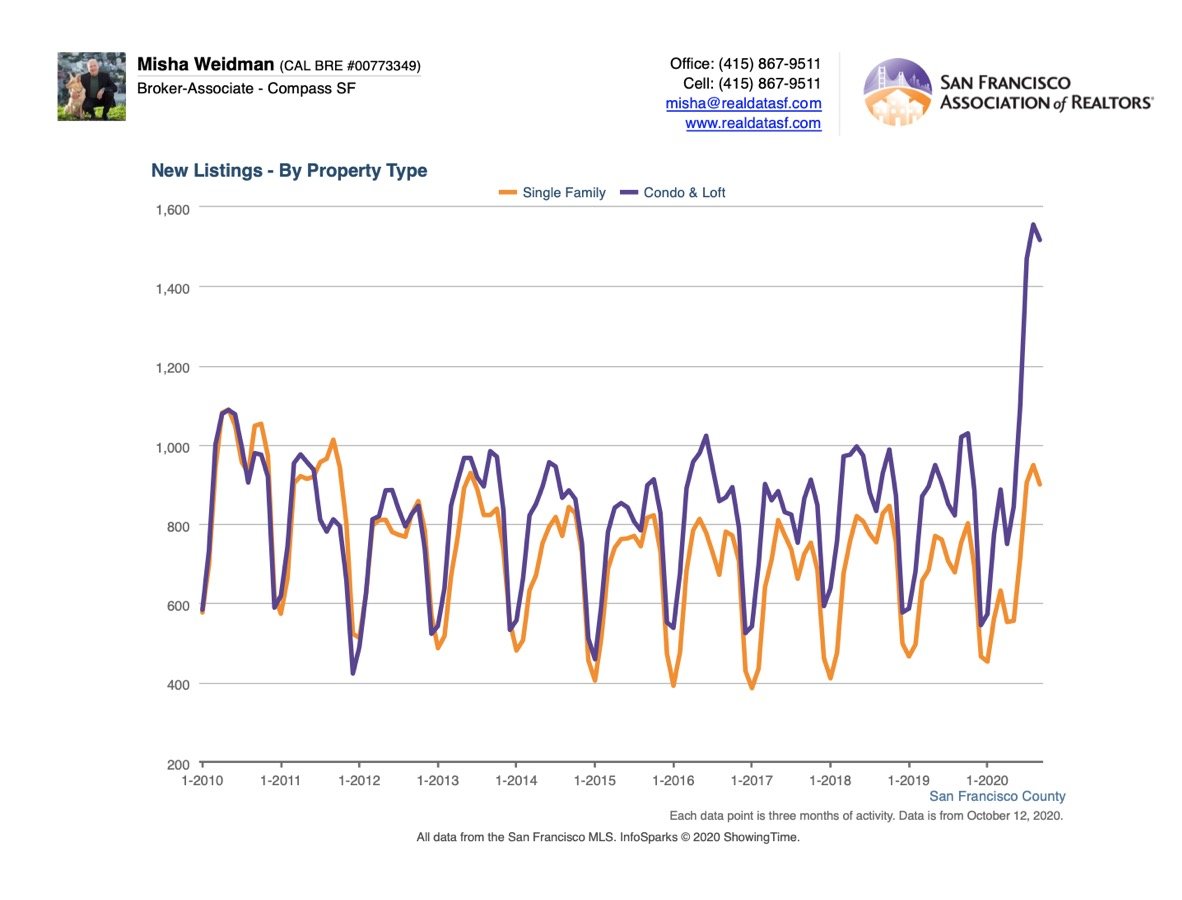
The first chart below shows that while the number of condo sales, relative to house sales, has decreased, it hasn’t decreased all that dramatically. The second chart, however, shows a huge increase in condo supply – I can’t go back further than 10 years, but “unprecedented” seems like a fair description. Clearly, then, what’s happening is that the increase in MSI for condos is being fueled by an enormous increase in supply.
Prognostications – Not!
I started this newsletter out by saying I was wrong – kind of. If you judge whether the market is strong or weak based on prices, the data doesn’t support a conclusion that the market is weak. However, there are some troubling signs. For condos, the huge spike in inventory without a corresponding increase in sales does not bode well. Condos are also seeing significant price reductions once they’re on the market. Not coincidentally, condos are more likely to be purchased by younger, less affluent buyers – the same ones who may now be facing layoffs or, alternatively, have been told by their employers that they can work remotely and are now seeking more space for their buck outside of SF, or even in a different state.
As for single family homes, MSI has increased too but not nearly as dramatically as for condos. While it’s true that buyers may be looking for alternatives outside SF, either to purchase as a primary home or as a second home “refuge,” it seems that there are still enough of them to consume SF’s chronically limited supply.
It’s going to be interesting to see how this all plays out as we head into the typically slow winter months after Thanksgiving. Add an election, the possibility of a second Covid wave or a miracle vaccine, and I think I’ll sit out any additional prognostications for now.
But that doesn’t have to stop you, gentle reader! Many of you regularly email me directly with astute comments about subjects I cover in my newsletters. I appreciate them so much! However, please consider expressing your views right on my website so that everyone can benefit from them and so that we can get a conversation going. It’s easy! Just click here!
As always, your questions, comments (especially on my website!), and referrals are much appreciated!
Misha
Fun and informative, Misha. Love the pic of you and Luna!